AllStarLink Node List and Bubble Chart
Contents:
- Node List
- Option 1 - AllStarLink Node List
- Option 2 - AllStarLink Active Nodes List
- Bubble Chart
[Top][Home]
Node List
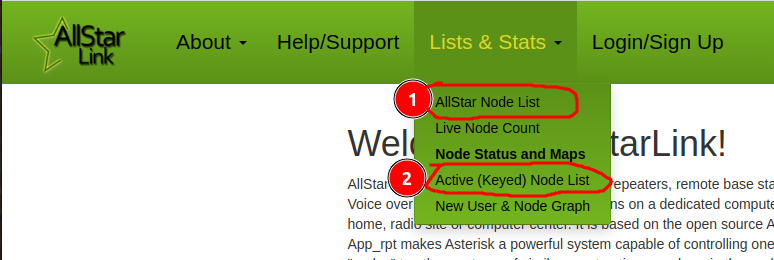
To generate the Node List and the Bubble Chart go to the AllStarLink
site https://www.allstarlink.org/ and
select Lists and Stats:

There are two options to gerneate a Bubble Chart
[Top][Home]
Option 1 - AllStarLink Node List
Select either one and type in the target node's callsign into the filter box on the
right hand side of the screen:
To generate a complete list of Nodes go to:
AllStarLink Node List:
https://www.allstarlink.org/nodelist/
Then type in the target node's callsign
into the filter box on the right hand side of the screen.
For Example,
set the filter to "VK4" to find local nodes in Queensland. The highlighted
nodes as currently Connected.
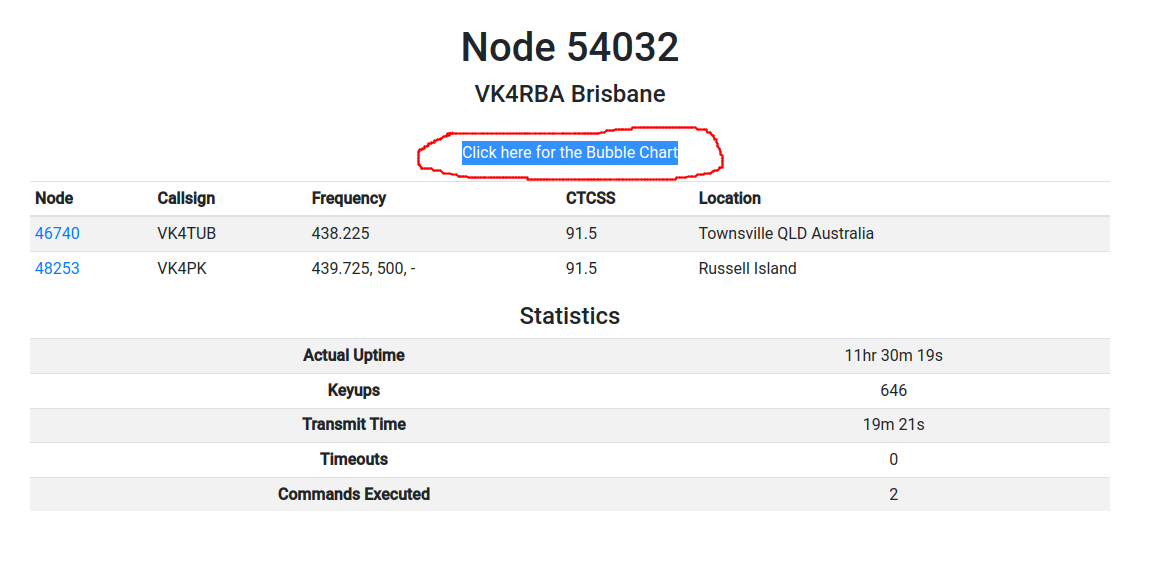
You can then click on the node ID and it will take you to a screen where you
can click on Click here for the Bubble Chart and a Bubble Chart
will be displayed.
[Top][Home]
Option 2 - AllStarLink Active Nodes List
To show only the active nodes select Option 2 or use this link.
AllStarLink Active Nodes List:
http://stats.allstarlink.org/
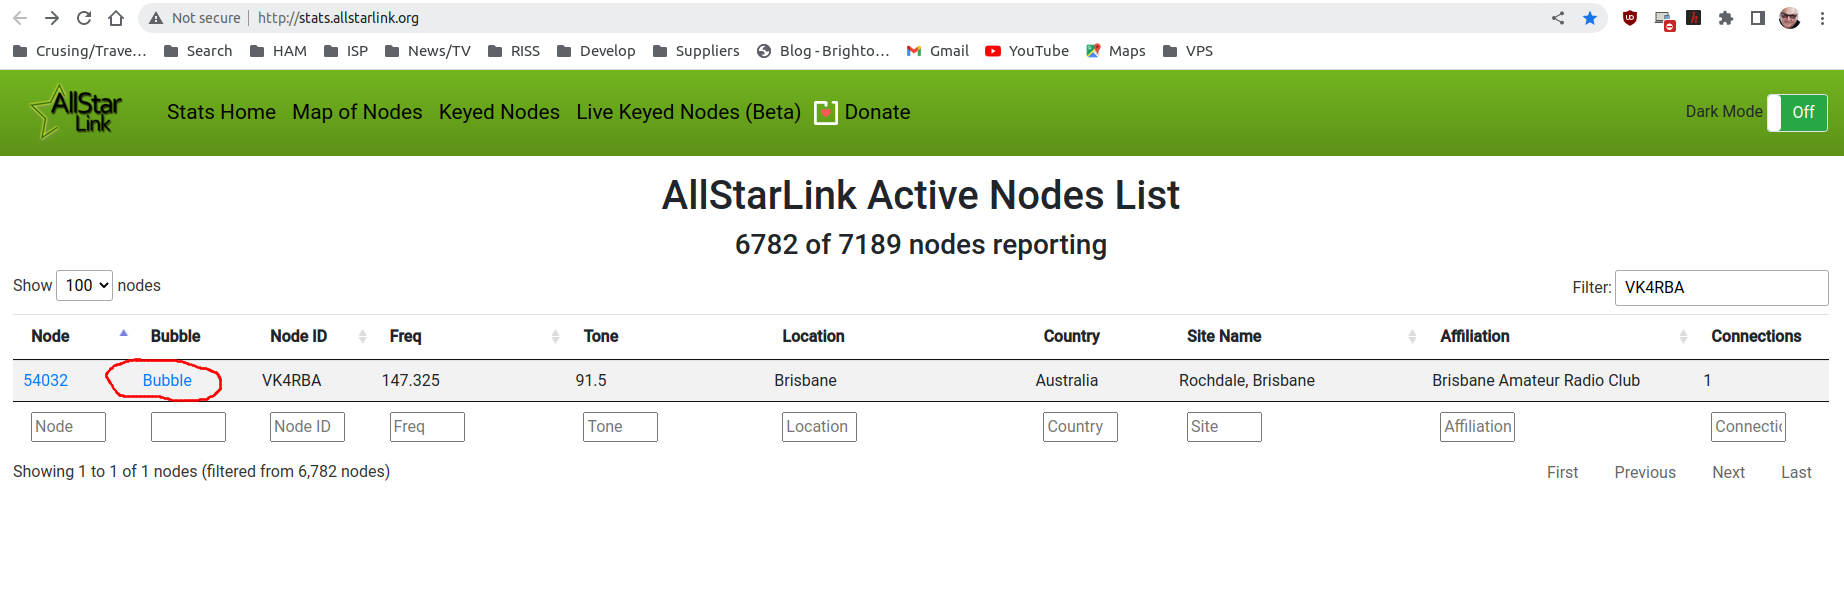
Then click on Bubble in the second column and the Bubble Chart
should appear.
[Top][Home]
Bubble Chart
The AllStarLink Bubble Chart will show you which nodes are currently
connected, and where you currently fit into the network. Some nodes are Repeaters
and some may be individual simplex type Nodes.
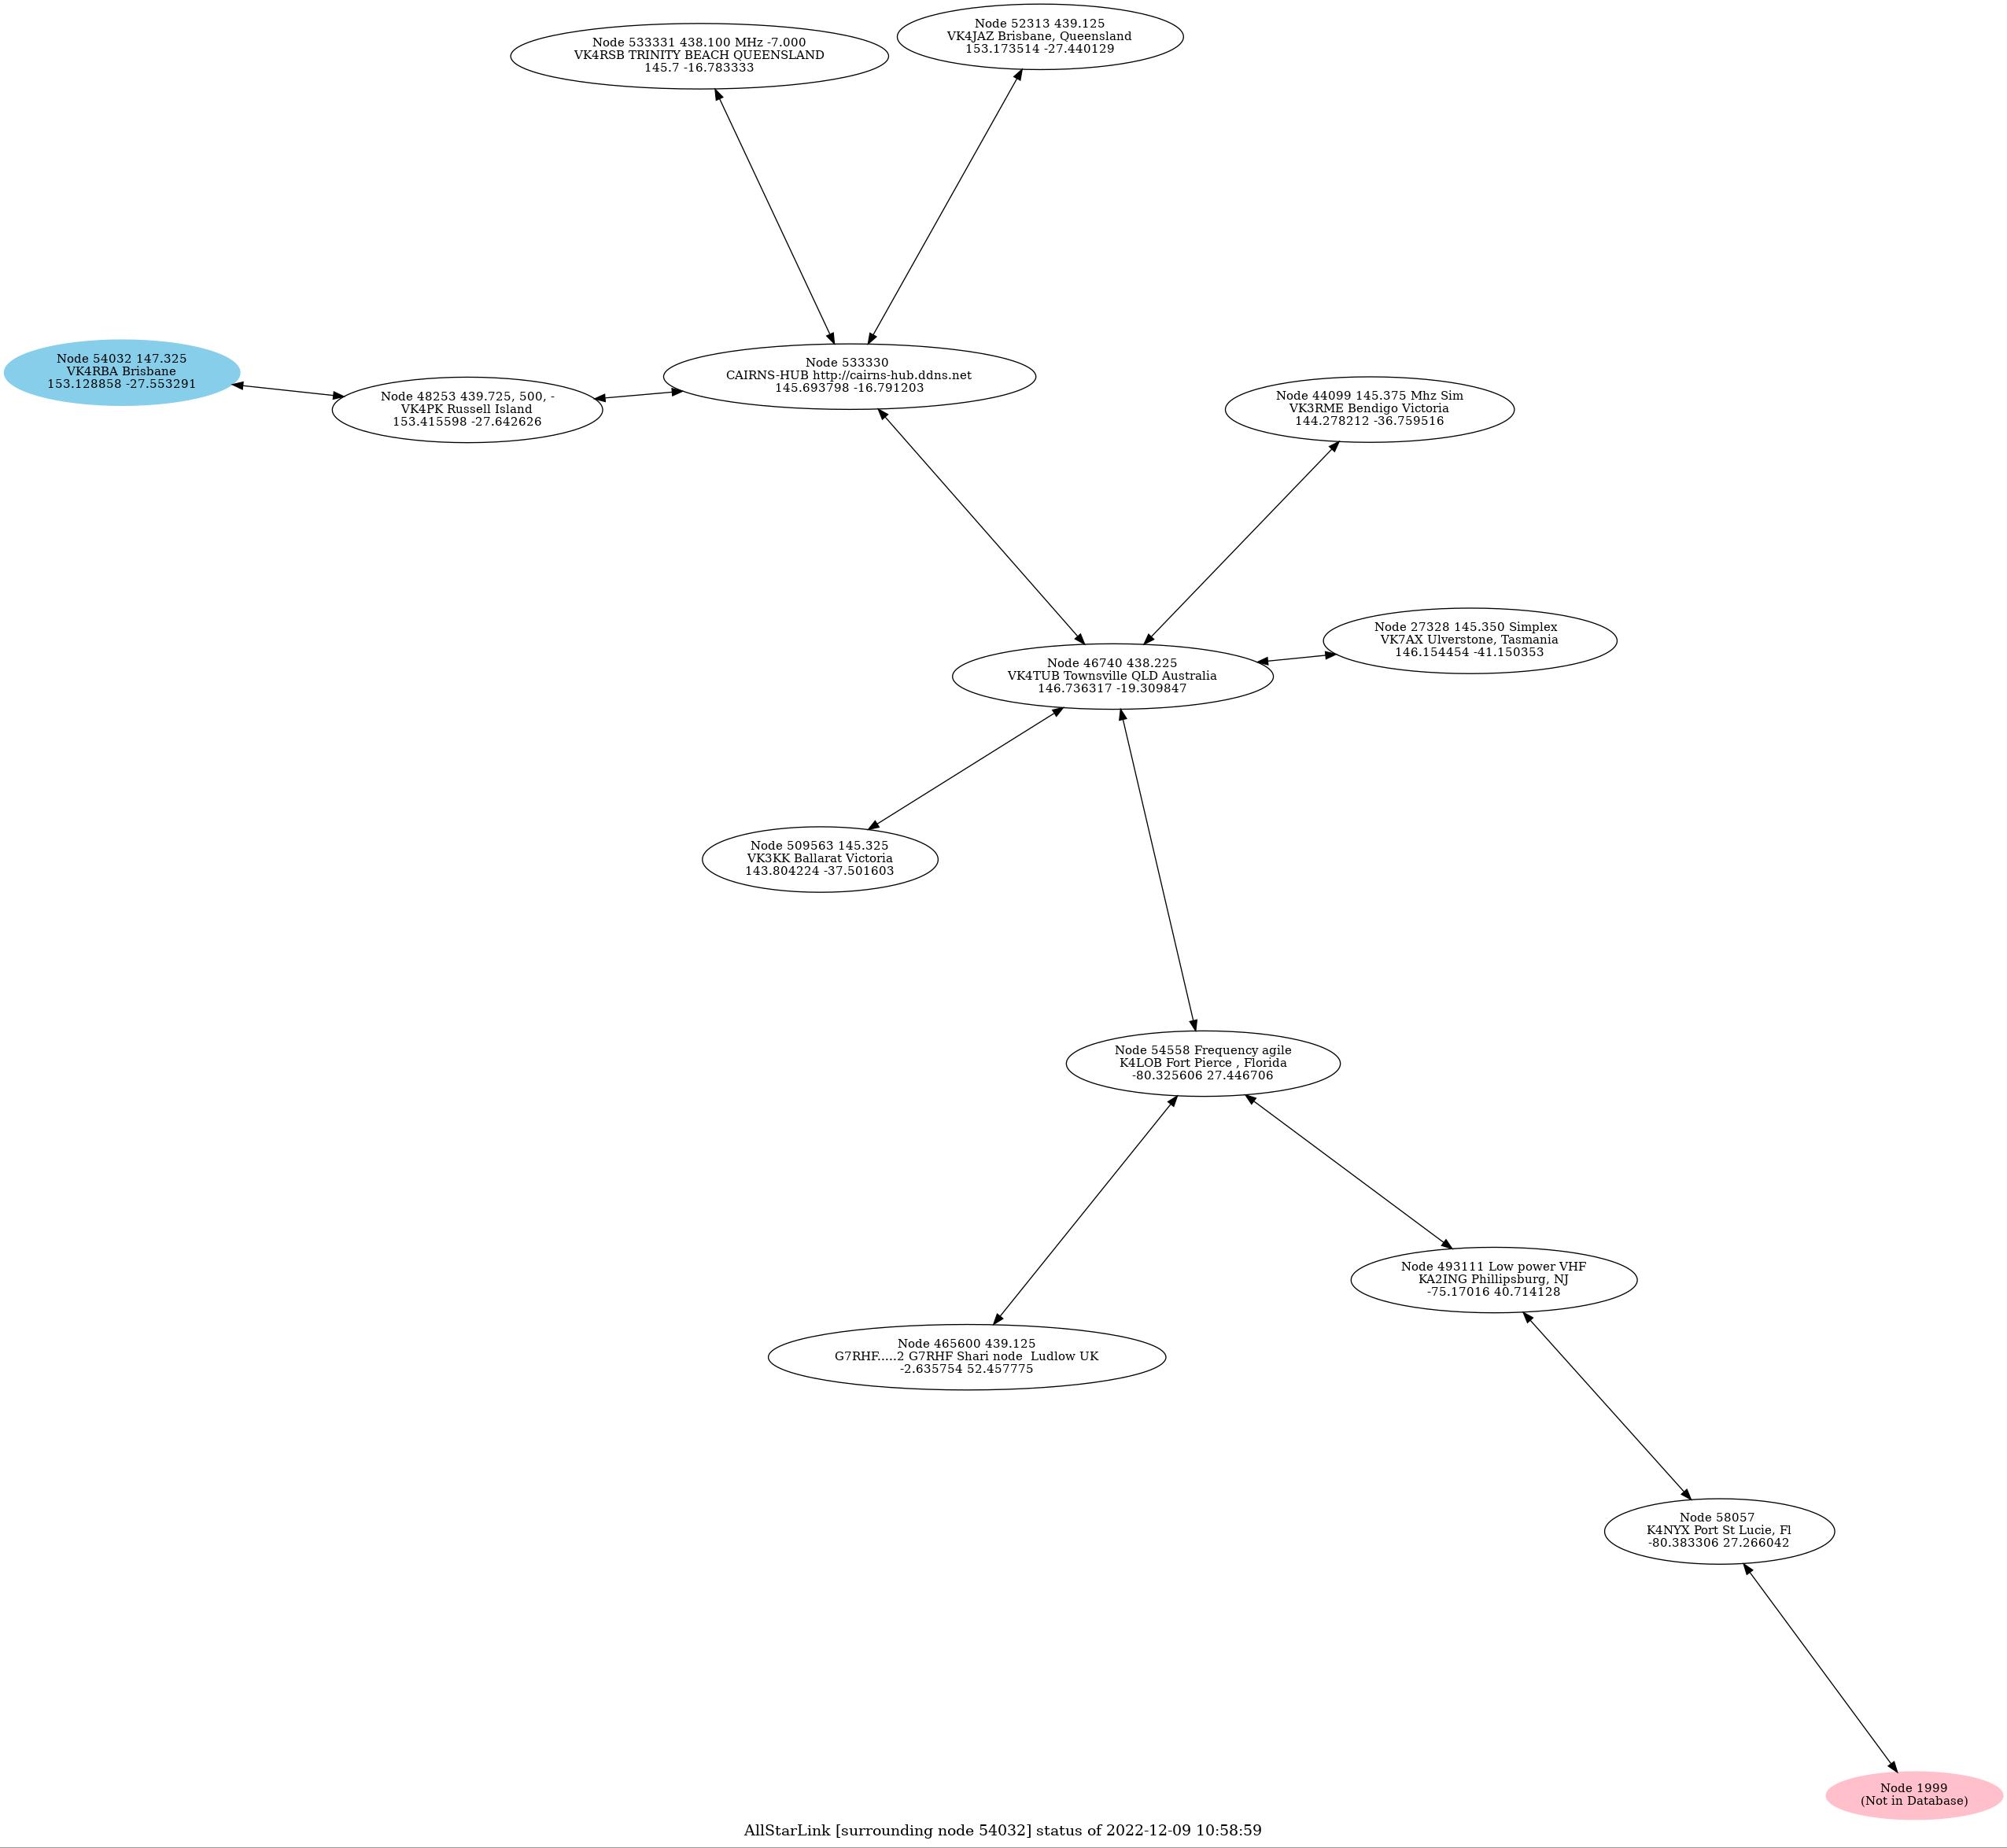
Note that this only details which AllStarLink nodes are currently attached. Unlike a
dashboard, it does not show who is listening on those nodes.
This is the topography that is current at the time of the enquiry. It will change
as nodes connect and disconnect.
[Top][Home]
Glenn Lyons VK4PK
glenn@LyonsComputer.com.au
Ver:gnl20221211 - pre published v0.9